Core Web Vitals Guide 2026: How to Improve LCP, INP and CLS
A website can have excellent content, strong backlinks, and an attractive design but still provide a frustrating experience.
The main content may take too long to appear.
A navigation menu may respond slowly when tapped.
Images, advertisements, or banners may suddenly push content around while someone is reading.
These problems affect how real people experience a website.
Core Web Vitals help website owners measure and improve these experiences.
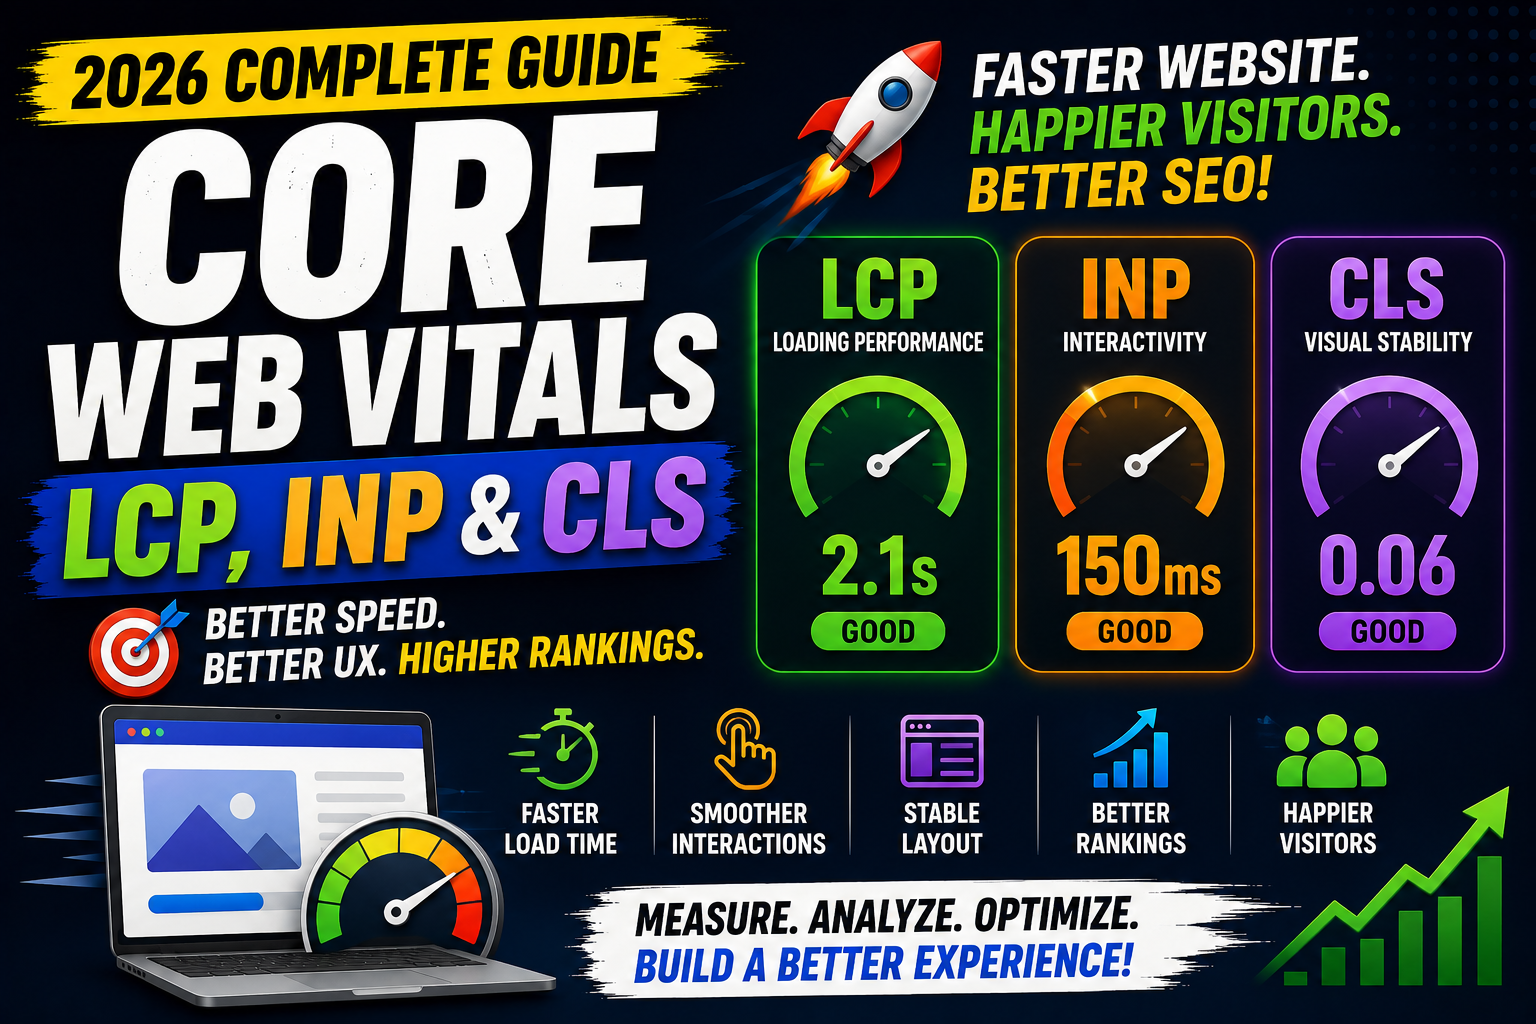
The three current Core Web Vitals are:
Largest Contentful Paint (LCP)
Interaction to Next Paint (INP)
Cumulative Layout Shift (CLS)
Together, they measure loading performance, responsiveness, and visual stability. Google's current “good” targets are an LCP of 2.5 seconds or less, an INP of 200 milliseconds or less, and a CLS score of 0.1 or less. These targets are evaluated at the 75th percentile of page visits, separately across mobile and desktop experiences.
In this complete Core Web Vitals guide, you will learn what each metric means, how to measure it, what causes poor scores, and how to improve website performance across WordPress, Blogger, and custom websites.
What Are Core Web Vitals?
Core Web Vitals are user-experience metrics designed to measure important aspects of webpage performance.
They answer three practical questions:
How quickly does the main content appear?
Measured by Largest Contentful Paint.
How quickly does the page respond when someone interacts with it?
Measured by Interaction to Next Paint.
Does the page remain visually stable while loading?
Measured by Cumulative Layout Shift.
Google describes Core Web Vitals as metrics that evaluate real-world loading performance, interactivity, and visual stability.
| Metric | What It Measures | Good Target |
|---|---|---|
| LCP | Loading performance | 2.5 seconds or less |
| INP | Interaction responsiveness | 200 milliseconds or less |
| CLS | Visual stability | 0.1 or less |
Why Core Web Vitals Matter
Core Web Vitals matter because performance directly affects users.
Imagine opening an article on your phone.
The page background appears, but the featured image and title take several seconds to load.
You tap the menu button, but nothing happens immediately.
When you begin reading, an advertisement loads above the content and pushes the paragraph downward.
The website technically works, but the experience feels slow and unstable.
Improving Core Web Vitals can help create:
Faster loading pages
More responsive interactions
Stable page layouts
Better mobile usability
A more professional user experience
Google recommends achieving good Core Web Vitals as part of providing a strong overall page experience. However, Google also advises site owners not to focus on only one or two page-experience signals. Content quality, relevance, usability, and other SEO factors still matter.
Passing Core Web Vitals does not guarantee top rankings.
A fast but irrelevant page will not automatically outrank a slower page that answers the user's query much better.
1. Largest Contentful Paint
What Is LCP?
Largest Contentful Paint measures loading performance.
It records how long it takes for the largest visible content element in the initial viewport to render.
The LCP element may be:
A featured image
A hero banner
A large heading
A large text block
A video thumbnail
A background image
For blogs and news websites, the featured image is often the LCP element.
What Is a Good LCP Score?
| LCP | Status |
|---|---|
| 2.5 seconds or less | Good |
| More than 2.5 to 4 seconds | Needs Improvement |
| More than 4 seconds | Poor |
Google's recommended goal is an LCP of 2.5 seconds or less for at least 75% of page visits.
Example of Poor LCP
Suppose your article contains:
A header
An article title
A featured image
The article body
The featured image is the largest visible element.
If the image appears after 4.5 seconds, the page may receive a poor LCP result.
The image itself may not be the only problem. Delays can also come from slow server response, blocking CSS, JavaScript, or late resource discovery.
Common Causes of Poor LCP
Poor LCP may be caused by:
Oversized featured images
Slow hosting
Slow server response
Render-blocking CSS
Heavy JavaScript
Too many third-party scripts
Delayed web fonts
Client-side rendering
Lazy-loading the primary image
Poor caching configuration
The first step is identifying the actual LCP element.
Do not begin randomly installing speed plugins before understanding what is slow.
How to Improve LCP
Compress the LCP Image
Large images are one of the most common causes of slow loading.
Before uploading an image:
Resize it to realistic display dimensions
Compress it
Convert it to WebP or AVIF
Avoid unnecessarily high resolution
Use responsive image versions
Do not upload a 5000-pixel image if it will only display at 1200 pixels.
Use Responsive Images
Responsive images allow browsers to select an appropriate file size.
<img
  src="core-web-vitals-1200.webp"
  srcset="
    core-web-vitals-480.webp 480w,
    core-web-vitals-768.webp 768w,
    core-web-vitals-1200.webp 1200w
  "
  sizes="(max-width: 768px) 100vw, 1200px"
  width="1200"
  height="630"
  alt="Core Web Vitals performance dashboard">
Mobile users should not need to download desktop-sized image files when a smaller version would be enough.
Avoid Lazy-Loading the LCP Element
Lazy loading is useful for images below the visible area.
However, lazy-loading the main featured image can delay its download.
Potentially problematic example:
<img
  src="featured-image.webp"
  loading="lazy"
  alt="Core Web Vitals Guide">
When the image is the main above-the-fold visual, test loading it normally.
Use lazy loading for non-critical images further down the page.
Prioritize the Important Image
You can tell the browser that an image has high priority:
<img
  src="featured-image.webp"
  fetchpriority="high"
  width="1200"
  height="630"
  alt="Core Web Vitals Guide">
You may also preload a critical resource:
<link
  rel="preload"
  as="image"
  href="featured-image.webp">
Do not preload every image.
Too many high-priority resources compete for bandwidth and may make performance worse.
Improve Server Response Time
A slow server delays every important resource.
Potential improvements include:
Better hosting
Server-side caching
Page caching
Database optimization
CDN usage
Removing unnecessary backend processing
For content-heavy websites, caching can dramatically reduce repeated server work.
Reduce Render-Blocking CSS
Large CSS files can delay the initial rendering process.
Consider:
Removing unused CSS
Minifying stylesheets
Loading critical CSS earlier
Deferring non-critical styles
Avoiding multiple large design libraries
Do not load an entire UI framework when the page uses only a small part of it.
Reduce Blocking JavaScript
JavaScript can delay rendering when it is downloaded and executed too early.
Example:
<script src="app.js" defer></script>
The defer attribute allows HTML parsing to continue before the script executes.
Only use asynchronous or deferred loading when it is compatible with the script's functionality.
2. Interaction to Next Paint
What Is INP?
Interaction to Next Paint measures responsiveness.
It evaluates how quickly a page visually responds after a user interaction.
Interactions may include:
Clicking a button
Opening a menu
Tapping a tab
Selecting a filter
Submitting a form
Expanding an accordion
A page may load quickly but still feel slow if buttons and menus respond late.
What Is a Good INP Score?
| INP | Status |
|---|---|
| 200 milliseconds or less | Good |
| More than 200 to 500 milliseconds | Needs Improvement |
| More than 500 milliseconds | Poor |
A good INP is 200 milliseconds or less, while values above 500 milliseconds are considered poor.
Example of Poor INP
A visitor taps the mobile menu.
The browser is currently processing a long JavaScript task.
The menu appears 700 milliseconds later.
The delay may make the website feel unresponsive or broken.
This is the type of interaction problem INP is designed to expose.
Common Causes of Poor INP
Poor INP can be caused by:
Heavy JavaScript
Long main-thread tasks
Complex event handlers
Large DOM structures
Third-party advertising scripts
Chat widgets
Excessive tracking code
Expensive rendering work
Large page-builder scripts
How to Improve INP
Remove Unnecessary JavaScript
Audit every script loaded on the page.
Ask:
Is this script still needed?
Is the same feature loaded twice?
Does this script run on pages where it is not used?
Can a lighter alternative replace it?
Is an old plugin still loading resources?
Removing unnecessary code is often more effective than trying to optimize code that should not exist.
Break Up Long Tasks
A long JavaScript task blocks the browser from responding to users.
Instead of processing a large operation continuously, break it into smaller tasks where possible.
This gives the browser opportunities to update the interface and handle user input.
Keep Event Handlers Lightweight
A simple button click should not trigger expensive page-wide calculations.
Bad pattern:
button.addEventListener("click", () => {
  // Large calculations
  // Multiple DOM updates
  // Network requests
  // Rebuilding the entire interface
});
Better pattern:
button.addEventListener("click", () => {
  menu.classList.toggle("is-open");
});
Keep immediate interaction work as small as possible.
Move non-critical work until after the visible response.
Reduce DOM Size
The DOM represents the structure of the page.
A very large DOM can increase styling, layout, and rendering work.
Avoid:
Excessive nested elements
Unnecessary wrapper elements
Huge hidden menus
Duplicate mobile and desktop sections
Page-builder structures with dozens of containers
Use simpler HTML where possible.
Review Third-Party Scripts
Third-party scripts may include:
Advertising
Analytics
Social embeds
Chat widgets
Heatmaps
Popups
Affiliate tools
Every script adds network and processing work.
This does not mean removing every third-party service.
It means checking whether each service provides enough value to justify its performance cost.
Update the Interface Before Heavy Work
When a user clicks a button, show the visual response first.
Then perform slower secondary operations when possible.
For example:
Display the loading state.
Allow the browser to render it.
Begin the expensive request or calculation.
This reassures the user that their action was recognized.
3. Cumulative Layout Shift
What Is CLS?
Cumulative Layout Shift measures visual stability.
It tracks unexpected movement of visible elements while a page is loading or being used.
Imagine reading an article and suddenly seeing the paragraph move because an advertisement appears above it.
You may lose your reading position or click the wrong button.
CLS helps identify this type of instability.
What Is a Good CLS Score?
| CLS | Status |
|---|---|
| 0.1 or less | Good |
| More than 0.1 to 0.25 | Needs Improvement |
| More than 0.25 | Poor |
Google's recommended good target is a CLS score of 0.1 or less.
Common Causes of Poor CLS
Poor CLS can be caused by:
Images without dimensions
Advertisements without reserved space
Late-loading banners
Cookie notices
Embedded videos
Web fonts
Dynamic widgets
Content inserted above existing content
Unstable navigation elements
How to Improve CLS
Add Image Width and Height
Always provide intrinsic image dimensions.
<img
  src="core-web-vitals.webp"
  width="1200"
  height="630"
  alt="Core Web Vitals optimization guide">
The browser can reserve the correct aspect ratio before the image finishes downloading.
Responsive CSS can still be used:
img {
  max-width: 100%;
  height: auto;
}
Reserve Space for Advertisements
Advertising is a common source of layout shifts.
If an ad loads without reserved space, it can push the article downward.
.ad-slot {
  min-height: 250px;
}
For responsive advertising, reserve enough space for the expected format at each screen size.
Do not place an empty giant container that harms readability. The reserved area should match the likely ad dimensions.
Reserve Space for Videos and Embeds
Use a fixed aspect ratio for video containers:
.video-wrapper {
  width: 100%;
  aspect-ratio: 16 / 9;
}
This prevents the page from changing height when the video or iframe appears.
Avoid Inserting Content Above Existing Content
Do not suddenly insert these elements above content after the page has loaded:
Promotional bars
App banners
Advertisements
Alerts
Subscription prompts
When such elements are necessary, reserve their space from the beginning or display them as overlays that do not rearrange the content.
Optimize Font Loading
Web fonts can change text dimensions after loading.
This may move headings, paragraphs, buttons, and navigation items.
Reduce font-related instability by:
Using fewer font families
Loading only necessary font weights
Choosing similar fallback fonts
Preloading critical fonts carefully
Hosting fonts efficiently
A blog usually does not need several font families and ten font weights.
Core Web Vitals vs PageSpeed Score
Core Web Vitals are not the same as your Lighthouse performance score.
A Lighthouse score is calculated from a controlled lab test.
Core Web Vitals may be assessed using field data from real users.
You might see:
Performance Score: 95
while the website still has poor field data.
You might also see a modest lab score while real users experience good Core Web Vitals.
Do not focus only on the large score shown at the top of PageSpeed Insights.
Review the individual metrics and diagnostics.
Field Data vs Lab Data
Field Data
Field data comes from actual users.
Those visitors may use:
Different phones
Different browsers
Slow networks
Old laptops
Different geographic locations
Field data provides insight into real-world performance.
Lab Data
Lab data is generated in a controlled environment.
It is useful for:
Debugging
Testing changes
Reproducing problems
Comparing performance before and after updates
Lab and field results can differ because real users do not all use the same devices and network conditions.
Use field data to understand actual user experience.
Use lab data to investigate and fix problems.
How to Measure Core Web Vitals
Google PageSpeed Insights
PageSpeed Insights provides:
Field data when available
Lab data
Performance opportunities
Diagnostic information
Mobile and desktop results
Review both device categories.
Do not test only the homepage.
Test:
Blog posts
Category pages
Product pages
Service pages
Landing pages
Google Search Console
The Core Web Vitals report in Search Console groups URLs with similar performance characteristics.
You may see groups categorized as:
Good
Needs improvement
Poor
If many blog posts use the same layout, one template-level problem may affect hundreds of URLs.
This makes template fixes especially valuable.
Lighthouse
Lighthouse can audit:
Performance
Accessibility
Best practices
SEO
It is useful during development and when comparing changes.
Chrome DevTools
Developers can use Chrome DevTools to investigate:
Main-thread tasks
Network requests
Layout shifts
JavaScript execution
Rendering delays
LCP resource loading
DevTools is especially useful when a general performance report does not clearly explain the technical cause.
Chrome User Experience Report
The Chrome User Experience Report, commonly called CrUX, contains aggregated real-user performance data where sufficient data is available.
Small websites may not have enough traffic for page-level field data.
In those situations, use lab tools and your own real-user monitoring where possible.
Core Web Vitals for WordPress
WordPress performance can be affected by:
Heavy themes
Large page builders
Excessive plugins
Large featured images
Poor hosting
Third-party scripts
A practical WordPress strategy includes:
Use reliable hosting.
Choose a lightweight theme.
Remove unnecessary plugins.
Optimize featured images.
Configure one caching solution.
Reduce unused CSS and JavaScript.
Use a CDN where beneficial.
Test important templates.
Do not install several performance plugins that all try to minify, delay, cache, and combine the same files.
Overlapping optimization tools can create conflicts.
Core Web Vitals for Blogger
Blogger websites can also experience performance issues.
Common causes include:
Heavy XML themes
Large thumbnail images
Unnecessary widgets
External font libraries
Social-media scripts
Advertising code
Excessive animation
For Blogger:
Use a lightweight responsive theme
Remove unused widgets
Compress every image
Use WebP images
Reduce external scripts
Reserve advertisement space
Avoid lazy-loading the main featured image
Test mobile article pages
Blogger manages hosting, but the theme, images, scripts, advertisements, and layout still affect the user experience.
Core Web Vitals for Custom HTML Websites
Custom websites provide greater control over performance.
Developers can directly optimize:
HTML structure
CSS delivery
JavaScript execution
Image loading
Fonts
Caching
Server configuration
However, custom code is not automatically fast.
Poorly structured JavaScript, oversized assets, and excessive animations can still produce bad results.
Measure before optimizing.
Images and Core Web Vitals
Images can affect both LCP and CLS.
Large images can delay LCP.
Images without dimensions can create layout shifts.
Image optimization should include:
Correct dimensions
Compression
WebP or AVIF formats
Responsive image sizes
Width and height attributes
Lazy loading for below-the-fold images
Priority loading for the main visual
For blogs and news websites, image optimization is often one of the highest-impact performance improvements.
Advertising and Core Web Vitals
Advertisements can affect all three metrics.
They may:
Delay loading
Execute additional JavaScript
Create layout shifts
Block the main thread
Add network requests
To reduce the impact:
Reserve advertisement space
Avoid inserting ads above content unexpectedly
Limit unnecessary ad formats
Review mobile placements
Monitor performance after monetization
Avoid overcrowding articles
A website should not become frustrating after advertisements are enabled.
Plan monetization and performance together.
Fonts and Core Web Vitals
Fonts can affect loading and visual stability.
Common problems include:
Too many font families
Multiple unused weights
Large font files
Slow external requests
Visually different fallback fonts
Use only the styles your website actually needs.
A publication may only need:
One regular body font
One bold weight
One heading style
Simple typography is often faster and easier to maintain.
Common Core Web Vitals Mistakes
Avoid these mistakes:
Chasing only a 100 PageSpeed score
Ignoring real-user data
Testing only the homepage
Lazy-loading the main image
Uploading oversized images
Omitting image dimensions
Loading unnecessary JavaScript
Using too many third-party tools
Failing to reserve ad space
Testing only on desktop
Installing multiple optimization plugins
Expecting field data to change immediately
Performance optimization should be based on measurement, not guesses.
Should You Aim for a 100 PageSpeed Score?
A score of 100 looks impressive.
However, it should not become your only goal.
Suppose your website improves from:
96 to 100
but still has:
Weak content
Poor internal linking
Broken pages
Incorrect search intent
Confusing navigation
The extra performance work may not be the highest priority.
Fix meaningful user problems first:
Slow main content
Delayed buttons
Unstable layouts
Oversized images
Heavy scripts
Then continue optimizing based on actual impact.
Core Web Vitals Audit Process
Use this practical process:
Open Google Search Console.
Review mobile and desktop Core Web Vitals reports.
Identify affected URL groups.
Select representative pages.
Test them in PageSpeed Insights.
Identify the LCP element.
Investigate interaction delays.
Find unexpected layout shifts.
Review images, fonts, ads, and scripts.
Implement focused fixes.
Test again in lab tools.
Monitor field data over time.
Do not change everything at once.
Document important updates so you can understand what improved or harmed performance.
Core Web Vitals Checklist
Before finishing your performance audit, check:
✅ LCP element identified
✅ LCP is 2.5 seconds or less
✅ INP is 200 milliseconds or less
✅ CLS is 0.1 or less
✅ Main image compressed
✅ Main image not unnecessarily lazy-loaded
✅ Responsive images used
✅ Image dimensions provided
✅ Off-screen images lazy-loaded
✅ JavaScript reviewed
✅ Long tasks investigated
✅ Third-party scripts audited
✅ Advertisement space reserved
✅ Font files optimized
✅ Mobile layouts tested
✅ Field data reviewed
✅ Multiple page templates tested
Core Web Vitals Strategy for 2026
A practical strategy looks like this:
Measure real-world performance.
Identify the failing metric.
Find affected page templates.
Locate the technical cause.
Prioritize high-impact fixes.
Optimize main images.
Reduce unnecessary JavaScript.
Improve server delivery.
Stabilize advertisements and embeds.
Test mobile interactions.
Compare before and after results.
Monitor field data.
The process is simple:
Measure. Diagnose. Fix. Test. Monitor.
Final Thoughts
Core Web Vitals are not just technical numbers inside PageSpeed Insights.
They represent real user experiences.
LCP asks:
How quickly can visitors see the main content?
INP asks:
How quickly does the website respond to them?
CLS asks:
Does the layout remain stable while they use it?
A strong website should load quickly, respond smoothly, and remain visually stable.
Do not optimize performance only to improve a screenshot or score.
Optimize for the person reading, clicking, scrolling, and interacting with your website.
Create useful content.
Build a lightweight interface.
Measure real performance.
Fix the actual bottleneck.
Test again.
Fast. Responsive. Stable.
That is the goal of Core Web Vitals optimization.
Frequently Asked Questions
1. What are Core Web Vitals?
Core Web Vitals are user-experience metrics that measure webpage loading performance, interaction responsiveness, and visual stability.
2. What are the three Core Web Vitals?
The three current Core Web Vitals are Largest Contentful Paint, Interaction to Next Paint, and Cumulative Layout Shift.
3. What is a good LCP score?
A good LCP is 2.5 seconds or less.
4. What is a good INP score?
A good INP is 200 milliseconds or less.
5. What is a good CLS score?
A good CLS is 0.1 or less.
6. Do Core Web Vitals affect Google rankings?
Google recommends good Core Web Vitals as part of a strong page experience, but performance alone does not guarantee high rankings. Content relevance, quality, usability, and other signals still matter.
7. Is PageSpeed score the same as Core Web Vitals?
No. PageSpeed and Lighthouse provide lab-based performance analysis, while Core Web Vitals can also be evaluated using real-user field data.
8. Why are my mobile and desktop results different?
Mobile devices may have slower processors, weaker networks, and smaller screens. Google evaluates mobile and desktop experiences separately.
9. Should I lazy-load every image?
No. Lazy loading is useful for off-screen images, but it may delay an important above-the-fold image that becomes the LCP element.
10. Should I aim for a 100 PageSpeed score?
A perfect score is not always necessary. Prioritize meaningful loading, responsiveness, and stability problems that affect real users.